
Key Takeaways
- Housing market shows overall strength despite month-to-month volatility
- Slight cooling in new loan commitments may reflect economic factors
- Significant year-on-year growth (29.5%) in investor housing commitments
- Potential increase in housing stock competition and affordability issues
- Sharp rise (38.6%) in business construction finance, but volatile indicator
- Decline in refinancing activity compared to previous year
- First home buyer segment stronger than last year despite monthly decline
- Varying proportions of first home buyer activity across states/territories
- Shift towards variable rate loans reflects changing interest rate expectations
- Overall growth in lending indicators compared to previous year
The Australian Bureau of Statistics has released its latest lending indicators report for May 2024, providing insights into new borrower-accepted finance commitments for housing, personal, and business loans. This comprehensive overview reveals significant trends in the lending landscape, reflecting the current state of the Australian economy and housing market.
Housing Finance
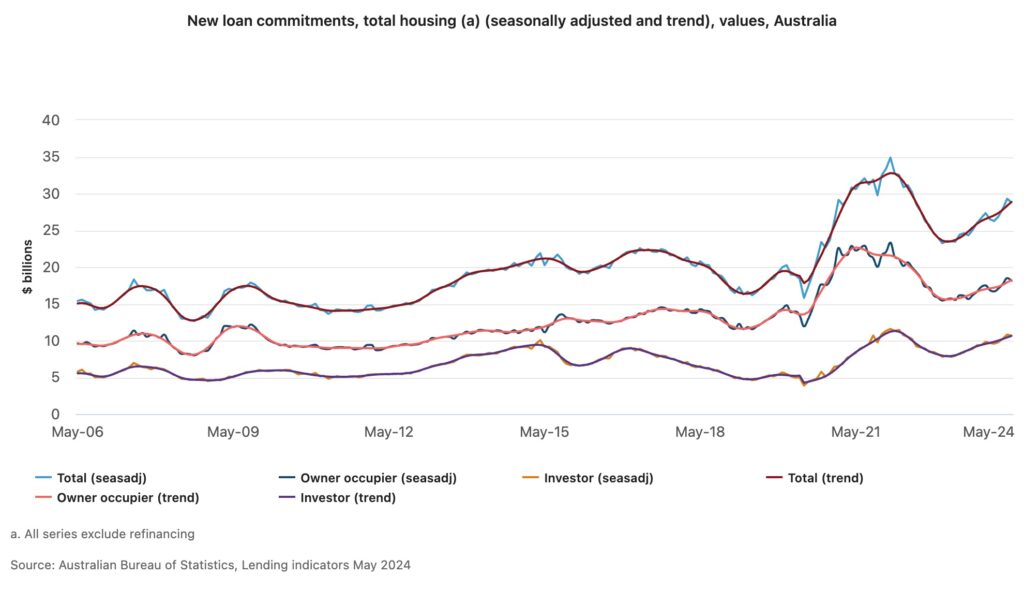
In May 2024, the value of new loan commitments for total housing experienced a 1.7% decline to $28.8 billion (seasonally adjusted), following a 4.8% increase in April. Despite this month-on-month decrease, the figure remains 18.0% higher compared to the same period last year, indicating sustained growth in the housing finance sector.
Breaking down the housing finance data:
- Owner-occupier housing: New loan commitmentsfell by 2.0% to $18.1 billion. However, this figure is still 12.2% higher than a year ago, suggesting ongoing strength in the owner-occupier market despite the monthly dip.
- Investor housing: Loan commitments decreased by 1.3% to $10.7 billion but remained an impressive 29.5% higher compared to May 2023. This substantial year-on-year growth highlights the continued attractiveness of property investment.
External Refinancing
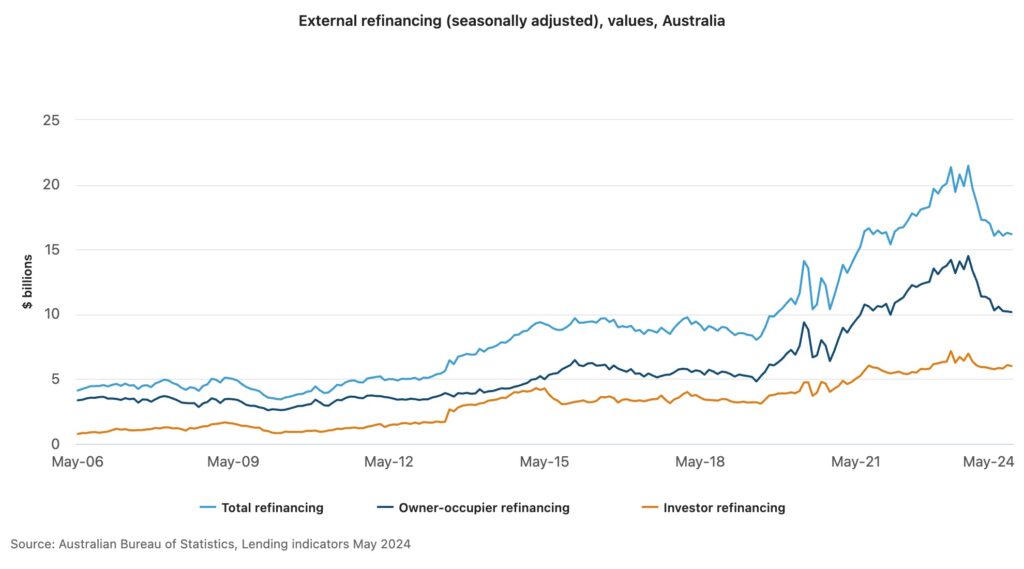
External refinancing is a refinance of a loan that is closed with one lender and replaced (refinanced) with a loan from a different lender.
The value of external refinancing for total housing saw a slight decrease of 0.7% to $16.2 billion in May 2024. Notably, this figure is 22.2% lower than the previous year, indicating a potential cooling in refinancing activity. The breakdown shows:
- Owner-occupier housing refinancing fell by 0.4% to $10.2 billion, down 27.8% year-on-year.
- Investor housing refinancing decreased by 1.1% to $6.0 billion, 10.5% lower than May 2023.
Personal Finance
The personal finance sector showed mixed results in May 2024:
- Fixed-term personal finance commitments fell by 0.7%, following a 0.9% rise in April.
- Loan commitments for road vehicles increased by 0.8%.
- Personal investment loan commitments saw a significant rise of 9.8%.
Business Finance
Business finance indicators presented volatile results:
- Construction finance rose sharply by 38.6% after a 1.6% fall in April. The trend terms showed a more modest 1.0% increase.
- Property purchase finance decreased by 1.8%, following a 2.8% rise in April. However, the trend terms indicated a 0.8% increase.
It’s worth noting that these business finance series can experience significant month-to-month fluctuations due to the influence of a small number of high-value loans.
Detailed Housing Finance Analysis
Owner-occupier Segment:
- Purchase of existing dwellings: Fell 2.2% but remained 10.4% higher year-on-year.
- Construction of new dwellings: Decreased by 0.7% but was up 14.7% compared to May 2023.
- Purchase of new dwellings: Dropped 5.6% but still 13.0% higher than the previous year.
State-by-State Performance (Owner-occupier):
- Western Australia, Queensland, and Tasmania showed growth, with increases of 2.6%, 0.8%, and 9.2% respectively.
- New South Wales experienced the largest decline at 7.9%, followed by the Northern Territory (-6.3%), Victoria (-2.4%), South Australia (-1.7%), and the Australian Capital Territory (-1.4%).
Investor Housing by State:
- Queensland led the growth with a 4.3% increase, followed by Western Australia (5.3%), the Australian Capital Territory (10.9%), Victoria (3.4%), and South Australia (3.1%).
- New South Wales saw the biggest fall at 9.0%, with the Northern Territory and Tasmania also experiencing declines.
Fixed vs. Variable Rate Loans
In original terms for May 2024:
- New variable rate loan commitments funded in the month increased by 12.5%.
- New fixed rate loan commitments funded rose by 71.0%, although they remained at historically low levels and were 61.7% lower than May 2023.
Average Loan Sizes
The average loan size for owner-occupier dwellings (including construction, purchase of new and existing dwellings; excluding land, alterations, and additions) remained stable at $626,000 in May 2024.
First Home Buyers
The first home buyer segment showed some weakness in May 2024:
- Nationally, the number of new loan commitments for owner-occupier first home buyers fell 3.3% to 9,873 (seasonally adjusted), following a 2.7% rise in April. However, this figure was still 3.7% higher than May 2023.
- All states and territories experienced declines, with the Northern Territory seeing the largest drop at 22.5%, followed by New South Wales at 7.9%.
In original terms, first home buyers accounted for:
- 2% of owner-occupier dwelling commitments
- 7% of total owner-occupier housing commitments (including land and alterations/additions)
State-by-state Analysis of First Home Buyers:
- The Northern Territory had the highest proportion of first home buyers at 43.3% of owner-occupier dwelling commitments, followed by the Australian Capital Territory (40.3%) and Victoria (39.4%).
- Queensland had the lowest proportion at 32.4%, followed closely by South Australia at 33.0%.
Implications and Outlook
The May 2024 lending indicators report paints a picture of a housing market that, while experiencing some month-to-month volatility, continues to show strength compared to the previous year. The decline in new loan commitments across various categories may suggest a cooling in the market in response to economic factors such as interest rate changes or shifts in property market dynamics.
The significant year-on-year growth in investor housing commitments (29.5%) is particularly noteworthy, indicating strong confidence in the property market as an investment vehicle given higher yields. This could potentially lead to increased competition for housing stock and may have further implications for housing affordability.
The sharp rise in business construction finance (38.6%) is encouraging for the commercial real estate and development sectors, although the volatility of this indicator means it should be interpreted with caution. The more stable trend increase of 1.0% provides a more reliable indication of growth in this area.
The continued decline in external refinancing activity compared to the previous year may suggest that many homeowners have already taken advantage of lower interest rates or that the benefits of refinancing are out of reach for those who can no longer service at a rate that’s high enough to be approved to refinance.
The first home buyer segment, while showing a monthly decline, remains stronger than a year ago. However, the varying proportions of first home buyers across different states and territories highlight the diverse nature of housing markets across Australia and the differing challenges faced by new entrants to the property market in various regions.
The shift towards variable rate loans and away from fixed-rate products reflects the changing interest rate environment and borrowers’ expectations of future rate movements. This trend could have implications for household budgets and financial stability if interest rates continue to rise.
In conclusion, while the May 2024 lending indicators show some signs of moderation in the housing market, the overall picture remains one of growth compared to the previous year. The varying performance across different loan types, states, and borrower categories underscores the different relative strengths and volatilities of each sector.