
Key Takeaways
- National Profitability:
- 94.3% of property resales in Q1 2024 achieved a nominal gain, the highest rate since July 2010.
- Approximately 85,000 resales were recorded, marking an 8.5% increase from the same quarter last year.
- House vs. Unit Performance:
- 97.1% of house resales made a nominal gain compared to 89.0% of units.
- Hold Period Trends:
- The median hold period for profit-making sales was 8.8 years, while loss-making sales had a median hold period of 8.4 years.
- Properties held for over 30 years had a median gain of $780,000.
- Short-Term Resales:
- As of March 2024, 7.1% of properties resold within two years made a nominal loss, a decrease from previous quarters.
- Short-term resales trends provide insights into household responses to rising mortgage rates.
- Sea Change and Tree Change Destinations:
- The combined regional dwelling market experienced a 3.3% uplift in home values year-to-date, outperforming the combined capitals at 2.9%.
- Lifestyle regions are seeing a resurgence in demand as capital city market values rise.
- Capital City Performance:
- Sydney: 91.6% resale profitability, with houses at 98.2% and units at 87.1%.
- Melbourne: 9.2% loss-making sales, with significant impact on the unit segment at 18.9%.
- Brisbane: Highest rate of profit-making resales among capital cities at 98.4%.
- Adelaide: 98.7% profit-making rate in the house segment, with strong market performance.
- Perth: 93.6% profit-making rate, with significant improvements in the unit market.
The CoreLogic Pain and Gain Report, June 2024, provides a comprehensive analysis of the Australian property market, offering valuable insights into resale profitability, market trends, and regional performance. This article explores the key findings of the report.
1. National Overview
The first quarter of 2024 saw 94.3% of property resales in Australia achieving a nominal gain, the highest rate of profit-making sales since July 2010. This remarkable figure underscores the robustness of the market amid consistent home value increases. Approximately 85,000 resales were recorded, marking an 8.5% increase from the same quarter last year. The national home value index rose by 1.7% during this period.
Table 1: Quarterly Change in Home Value Index vs. Profit-Making Sales Rate
| Quarter | Home Value Index Change | Profit-Making Sales Rate |
|---|---|---|
| Mar 2023 | 1.5% | 92.5% |
| Dec 2023 | 1.3% | 94.0% |
| Mar 2024 | 1.7% | 94.3% |
The upward trend in profit-making sales has been driven by strong growth cycles, reflected in the rolling quarterly change in the Home Value Index.
2. Houses vs Units
Across Australia, houses have consistently outperformed units in terms of profitability. In the March quarter of 2024, 97.1% of house resales made a nominal gain compared to 89.0% of units. This gap has widened since March 2020, highlighting the increasing value of detached houses over units.
Table 2: Proportion of Total Resales at a Loss/Gain (Houses vs. Units)
| Region | Houses (Gain) | Houses (Loss) | Units (Gain) | Units (Loss) |
|---|---|---|---|---|
| Sydney | 98.2% | 1.8% | 87.1% | 12.9% |
| Melbourne | 97.4% | 2.6% | 81.1% | 18.9% |
| Brisbane | 99.4% | 0.6% | 96.8% | 3.2% |
| National Average | 97.1% | 2.9% | 89.0% | 11.0% |
Chart 1: Rolling Three Month Rate of Loss-Making Sales (Houses vs. Units)
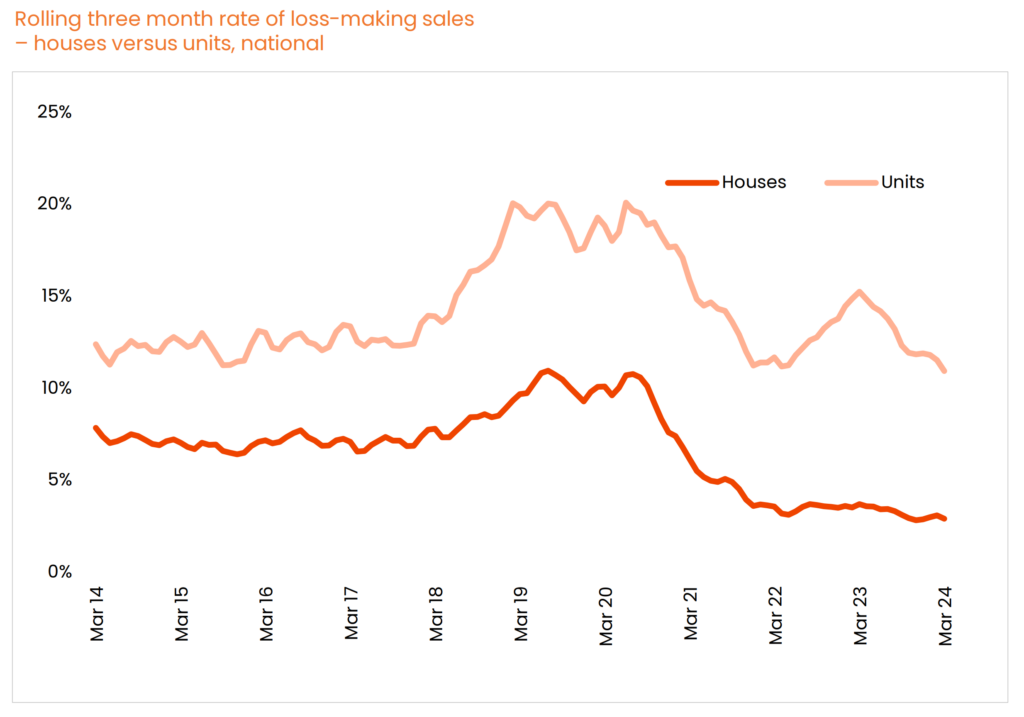
(Source: CoreLogic Pain and Gain Report, June 2024)
3. Hold Periods
The median hold period for profit-making sales was 8.8 years, while loss-making sales had a median hold period of 8.4 years. This indicates that properties held longer generally yielded higher returns. For example, properties held for over 30 years had a median gain of $780,000.
Table 3: Median Nominal Return from Resales by Hold Period
| Hold Period (Years) | Median Nominal Gain |
|---|---|
| <= 2 | $82,000 |
| 2 – 4 | $180,000 |
| 4 – 6 | $255,000 |
| 6 – 8 | $310,000 |
| 8 – 10 | $345,000 |
| 10 – 12 | $435,000 |
| > 30 | $780,000 |
Chart 2: Number of Transactions by Hold Period
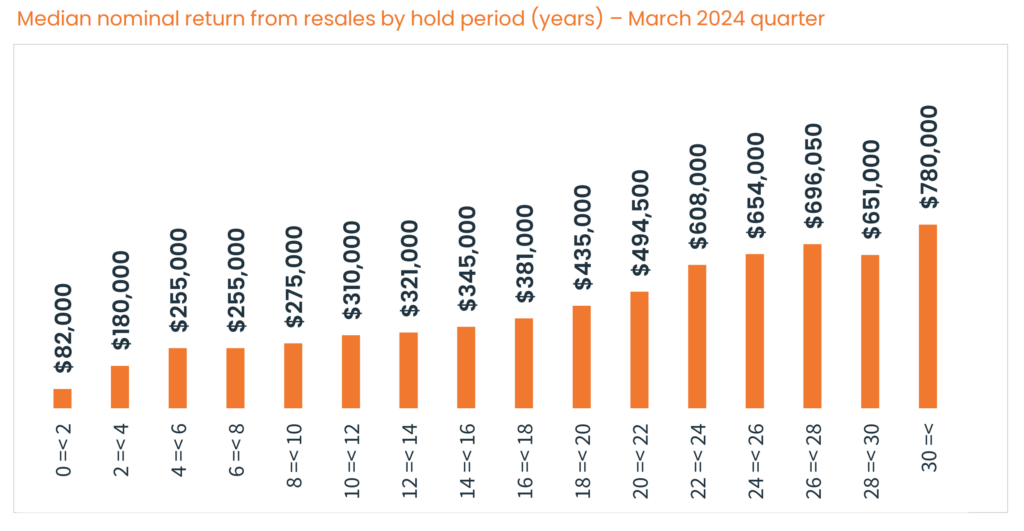
(Source: CoreLogic Pain and Gain Report, June 2024)
4. Short-Term Resales
Short-term resales, particularly those held for two to three years, provide insights into household responses to rising mortgage rates. As of March 2024, 7.1% of properties resold within two years made a nominal loss, a decrease from previous quarters.
Chart 3: Portion of Resales with Up to 2-Year and 3-Year Hold Periods
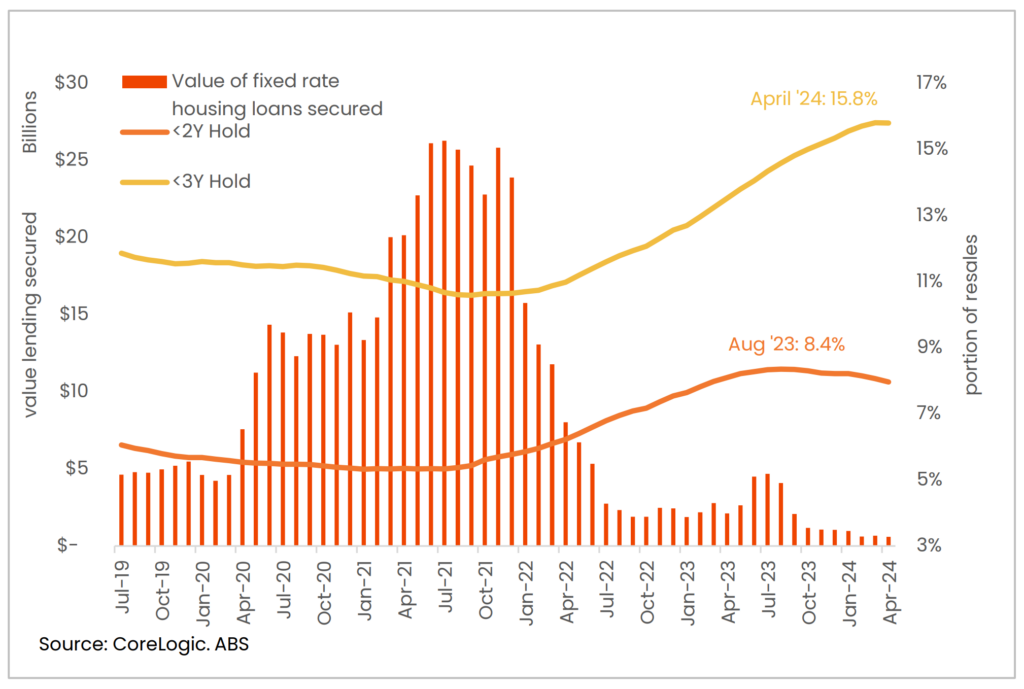
(Source: CoreLogic Pain and Gain Report, June 2024)
5. Resource-Based Markets
Resource-based markets have shown significant improvements in profitability. In the March quarter of 2024, 13.4% of resales in these markets made a loss, down from 20.8% the previous year. Increased mining activity and construction projects have driven this positive trend.
6. Sea Change and Tree Change Destinations
Lifestyle regions, known for sea change and tree change trends, have seen a resurgence in demand. The combined regional dwelling market experienced a 3.3% uplift in home values year-to-date, outperforming the combined capitals at 2.9%.
7. Capital City Analysis
Sydney
Sydney’s resale profitability remained steady at 91.6%. Detached houses saw a 98.2% profit-making rate, while units had 87.1%.
Table 4: Summary of Profit and Loss-Making Sales by LGA Region (Sydney)
| LGA Region | Profit-Making Sales | Loss-Making Sales | Median Hold Period | Median Profit |
|---|---|---|---|---|
| Parramatta | 75% | 25.3% | 7.8 years | $165,000 |
| Blacktown | 93% | 6.8% | 8.0 years | $390,000 |
Melbourne
Melbourne saw a decline in resale profitability to 9.2% loss-making sales. The unit segment was particularly impacted, with 18.9% of unit resales making a loss.
Table 5: Summary of Profit and Loss-Making Sales by LGA Region (Melbourne)
| LGA Region | Profit-Making Sales | Loss-Making Sales | Median Hold Period | Median Profit |
|---|---|---|---|---|
| Boroondara | 80% | 19.7% | 11.0 years | $380,050 |
| Port Phillip | 76% | 23.9% | 12.4 years | $161,000 |
Brisbane
Brisbane had the highest rate of profit-making resales among capital cities at 98.4%. This trend was evident in both the house and unit markets.Table 6: Summary of Profit and Loss-Making Sales by LGA Region (Brisbane)
| LGA Region | Profit-Making Sales | Loss-Making Sales | Median Hold Period | Median Profit |
|---|---|---|---|---|
| Ipswich | 99% | 0.6% | 6.8 years | $265,750 |
| Logan | 100% | 0.4% | 7.4 years | $305,000 |
Adelaide
Adelaide’s resale market also showed strong performance, with a 98.7% profit-making rate in the house segment.Table 7: Summary of Profit and Loss-Making Sales by LGA Region (Adelaide)
| LGA Region | Profit-Making Sales | Loss-Making Sales | Median Hold Period | Median Profit |
|---|---|---|---|---|
| Campbelltown | 99% | 0.7% | 9.3 years | $325,500 |
| Charles Sturt | 99% | 0.6% | 8.6 years | $302,000 |
Perth
Perth showed significant improvements, with a 93.6% profit-making rate. The unit market in Perth also saw gains, although still lower compared to houses.Table 8: Summary of Profit and Loss-Making Sales by LGA Region (Perth)
| LGA Region | Profit-Making Sales | Loss-Making Sales | Median Hold Period | Median Profit |
|---|---|---|---|---|
| Vincent | 71% | 29% | 9.8 years | $425,000 |
| Subiaco | 73% | 27% | 10.1 years | $410,000 |