According to the latest data from CoreLogic’s June 2024 Monthly Housing Chart Pack, the Australian real estate market keeps powering along despite interest rates, with residential properties now valued at a combined $10.7 trillion.
In recent months, the pace of growth in dwelling values has notably increased. The lower quartile of the market saw a significant 3.0% increase over the three months leading up to May 2024.
There are also significant regional differences in the market, with Perth (2.0%) and Adelaide (1.8%) experiencing record-high dwelling values in May. On the other hand, markets in Hobart (-0.3%) and Darwin are facing declines, entailing regional disparities.
Listings and Sales Dynamics
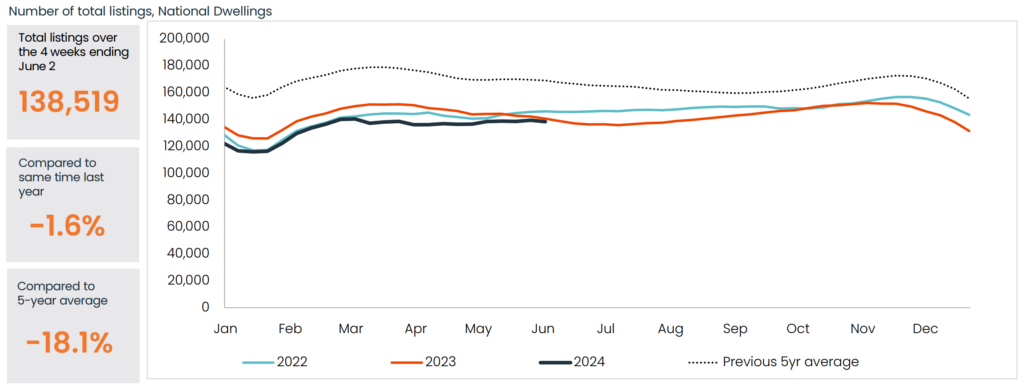
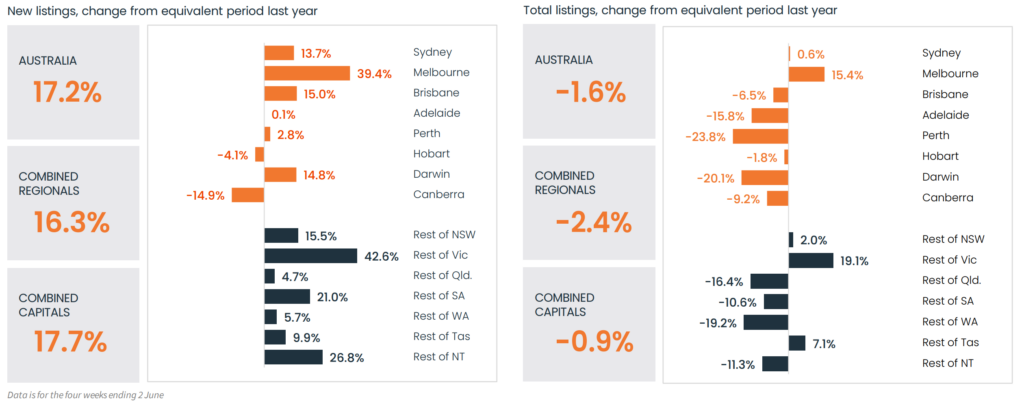
The current state of property listings in Australia reveals a notable trend. As of the four weeks ending June 2nd, the total number of properties listed for sale was 138,519. This figure is significantly lower than the levels recorded in 2022 and 2023 and falls below the previous five-year average.
The current state of property listings in Australia reveals a notable trend. As of the four weeks ending June 2nd, the total number of properties listed for sale was 138,519. This figure is significantly lower than the levels recorded in 2022 and 2023 and falls below the previous five-year average.
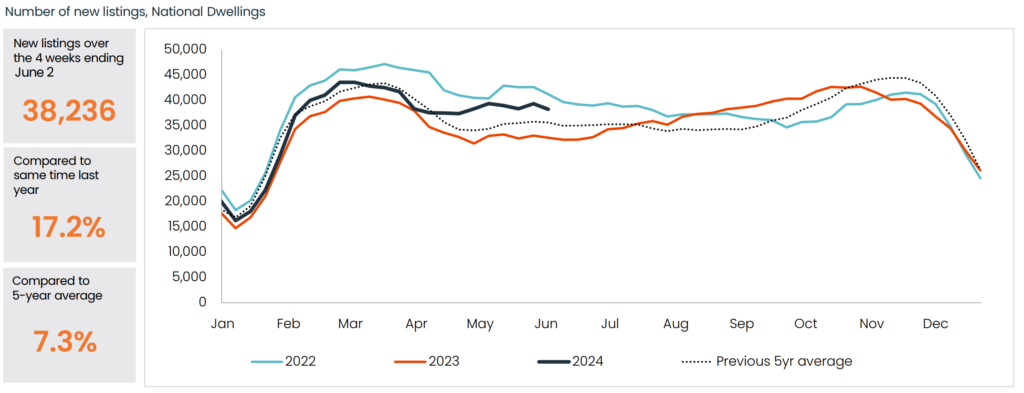
Despite the overall lower total listings, new listings have shown a different trend. In the same four-week period, there were 38,236 new listings, which is higher than the historic five-year average.
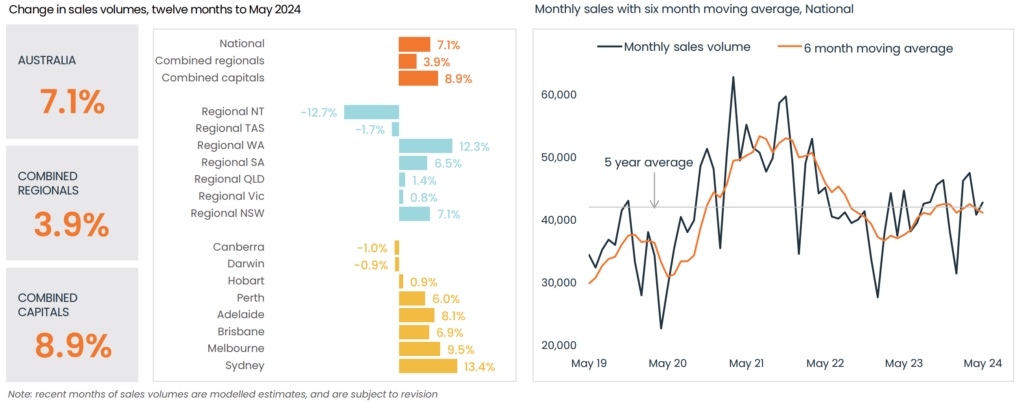
Sales volume has also been robust. In May alone, 42,944 homes were sold, contributing to a rolling annual count of 503,729. This represents a 7.1% increase from the previous year.
First Home Buyers vs. Investors
In April, the total value of home lending increased by 4.8% to reach $29.4 billion. The majority of this increase, approximately 57%, was attributed to loans for owner-occupiers. However, the rate of increase was higher for loans for investment properties, which rose by 5.6% compared to a 4.3% increase for owner-occupier loans.
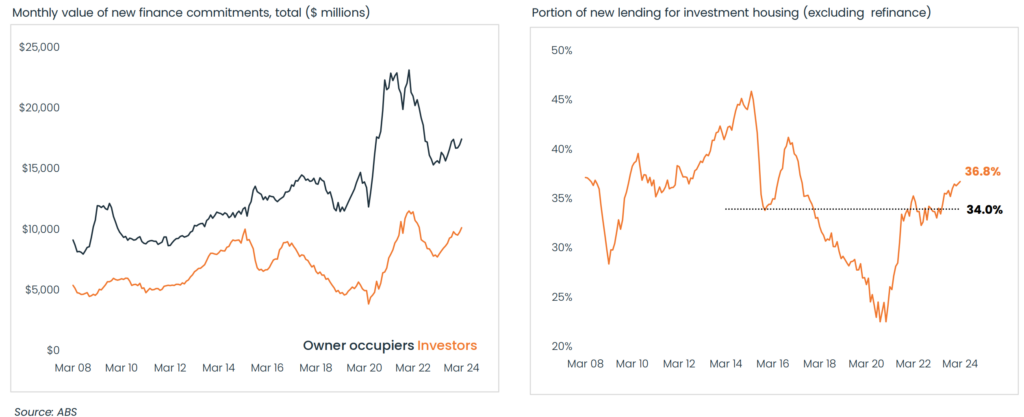
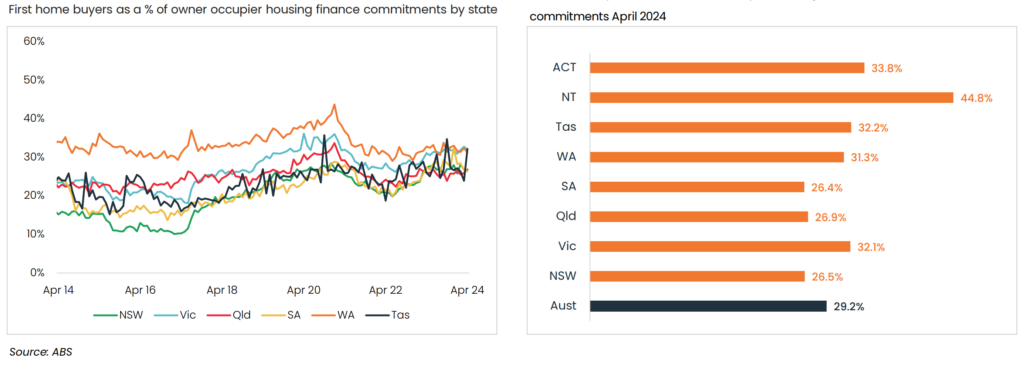
The value of first-home buyer (FHB) finance rose by 3.4% to $5.4 billion. FHBs made up 29.2% of the value of owner-occupied lending, a slight decrease from the previous month’s 29.5% but still well above the historic decade average of 24.6%. While there was a small drop in the percentage of first-home buyer loans compared to the previous month, their participation in the market remains significantly higher than the average over the past ten years and there’s continued reporting of FOMO driving buyer activity.
That said, the Australian property market is changing when comparing first-home buyers and investors. Investor loans comprised 37.0% of new mortgages, up from 36.7% in March. This is the highest level since May 2017, which means that investors are more active in the market.
The reason for this high activity is due to low vacancy rates and higher rental yields. However, in Victoria, there’s an oversupply of housing compared to the demand for purchases, which made it less appealing for investors. Victoria stands out among the states and territories with notably higher total listings than last year, with an increase from 42.6% in 2023 to 19.1% in 2024.
Housing Cycles of Capital Cities
| City | May | Quarter | Year |
|---|---|---|---|
| Sydney | +0.6% | +1.2% | +7.4% |
| Melbourne | +0.1% | -0.2% | +1.8% |
| Brisbane | +1.4% | +3.9% | +16.3% |
| Adelaide | +1.8% | +4.3% | +14.4% |
| Perth | +2.0% | +6.1% | +22.0% |
| Hobart | -0.5% | +0.3% | -0.1% |
| Darwin | -0.3% | +1.9% | +3.5% |
| Canberra | +0.5% | +0.7% | +2.0% |
Based on the table above:
- Monthly Performance
Perth (2.0%) and Adelaide (1.8%) stood out with the highest increases. However, Hobart (-0.5%) and Darwin (-0.3%) experienced declines.
- Quarterly Performance
Perth (6.1%) and Adelaide (4.3%) maintained strong growth. Melbourne (-0.2%) was the only city to experience a decline over the quarter.
- Yearly Performance
Perth (22%) and Brisbane (16.3%) were the top performers, with their annual growth rates. Conversely, Hobart was the only city with a slight annual decline (-0.1%).
Market Pressures and Trends
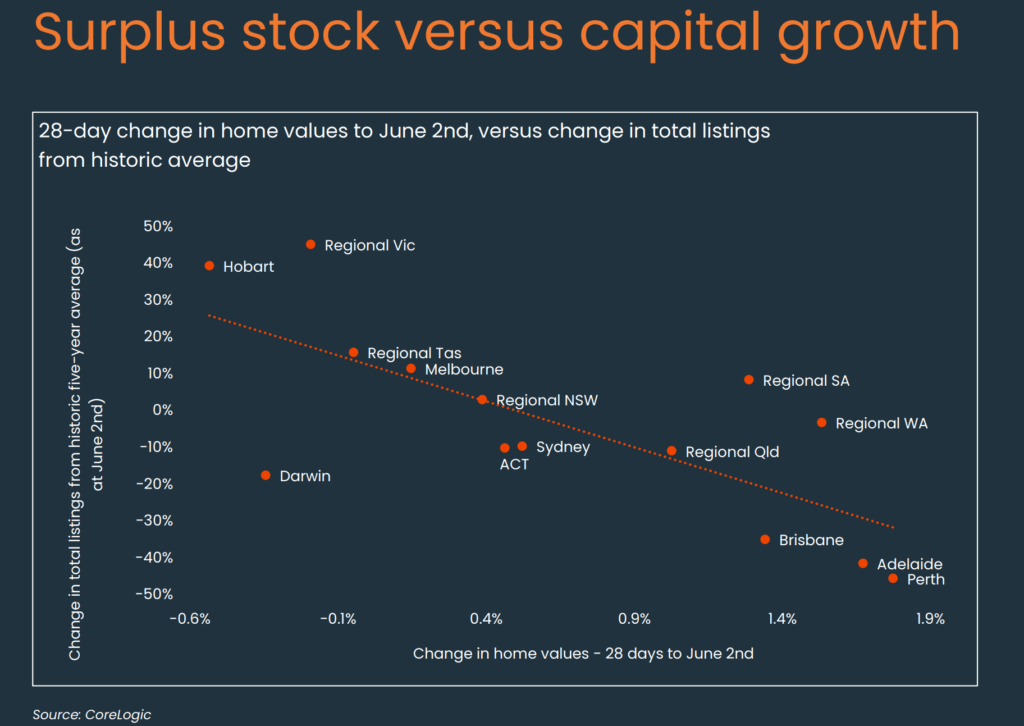
A scatter plot comparing the 28-day change in home values (x-axis) to the change in total listings from the historic average (y-axis) for various capital cities and regions across Australia as of June 2nd
Relationship between Stock and Price Growth
Areas with higher positive deviations from the historic average in total listings (surplus stock) tend to experience lower or negative growth in home values over the 28-day period. Conversely, areas with lower negative deviations from the historic average (tighter supply) tend to experience higher growth in home values.
Areas with Above-Average Stock Levels
There are more homes for sale than usual in Tasmania and Victoria, which means more homes are available than people wanting to buy them.
Areas with Below-Average Stock Levels
In Brisbane, Adelaide, and Perth, the inventory of homes for sale is reduced, which limits the buyers’ options. The imbalance between supply and demand has led to a rapid price increase in these regions.