
Business confidence and trend levels have taken a hit despite rising costs and hiking prices.
The latest NAB Monthly Business Survey comprehensively reviews the Australian economy in May 2024. The sluggish economic activity seen in Q1 has persisted into Q2, with business conditions gradually declining. Despite the challenges, the employment numbers ticked upward.
Cost and price growth measures increased in the month, including retail prices, which saw a significant increase after a period of decline or stability.
The report demonstrated the sector-specific fluctuations, highlighting the varied performance across different industries. Consumer-facing sectors such as retail and recreation experienced significant declines, while the wholesale and manufacturing sectors improved.
Overview and Key Findings
In April 2024, business confidence had a net balance of 2. However, by May 2024, this figure had sharply declined to -3. Business conditions also saw a decline of -1.
Trading conditions and profitability experienced a notable decrease, with the net balance falling from 13 to 10. Despite this, the employment trend improved.
Meanwhile, capital expenditure and exports declined, with forward orders remaining negative.
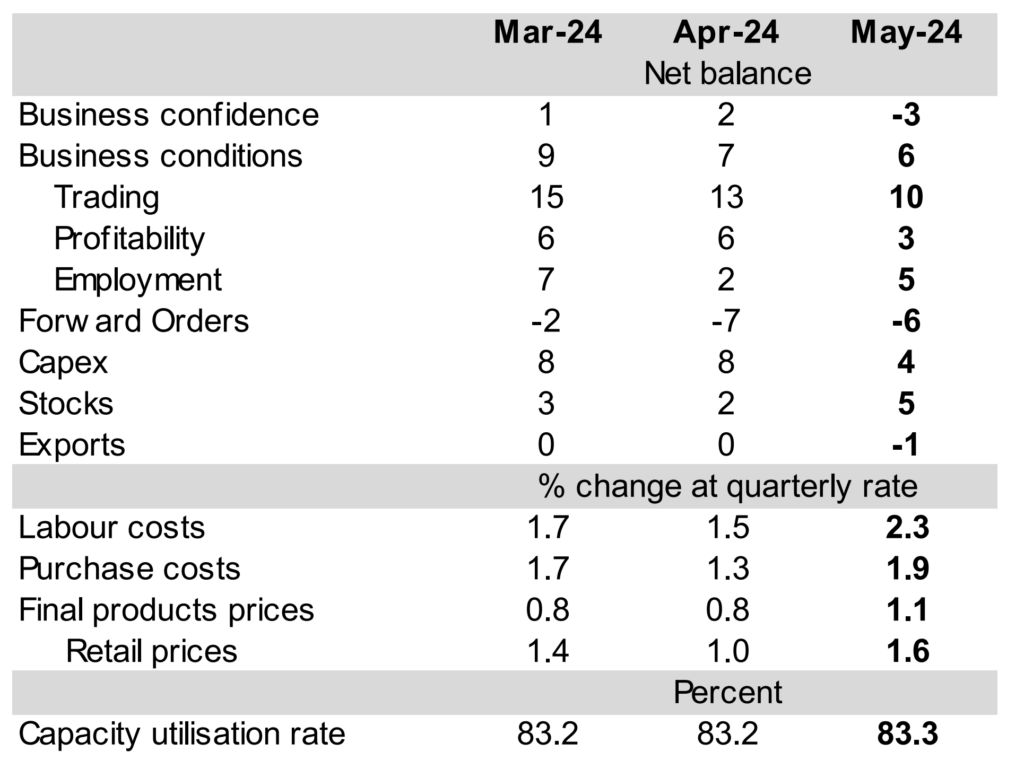
Despite the decline in business conditions, the capacity utilisation rate remained relatively stable, from 83.2% to 83.3%.
In summary, business confidence and conditions declined generally, with notable decreases in trading and profitability. However, employment improved slightly, and stock increased. The rise in labour and purchase costs and higher final product and retail prices point to increasing inflationary pressures.
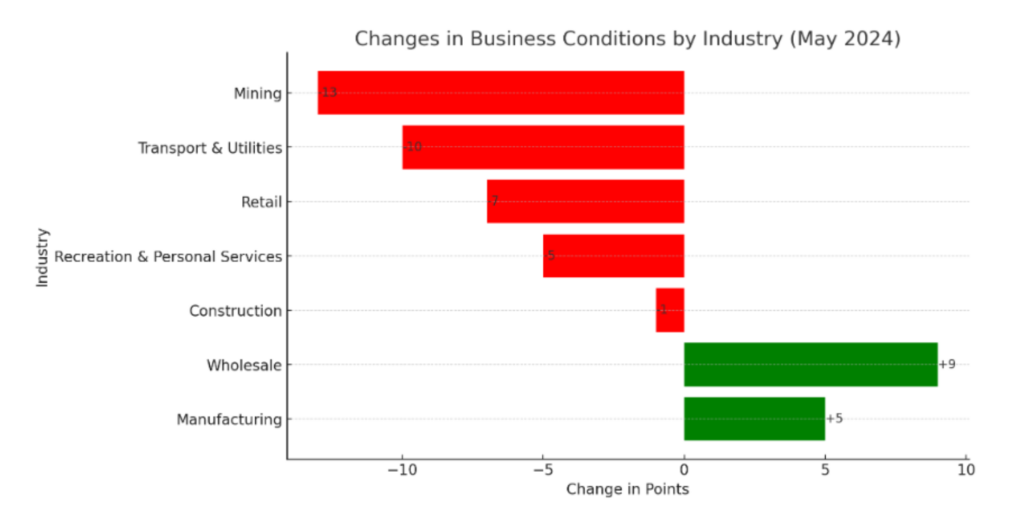
A bar chart visualising the changes in business conditions by industry for May 2024. Declines are shown in red, while increases are shown in green.
Different industries experienced changes in their conditions. Mining, transport and utilities, retail, recreation and personal services, and construction saw declines, with mining experiencing the largest drop of 13 points.
Wholesale and manufacturing businesses saw improvements, with wholesale increasing by 9 points and manufacturing by 5 points.
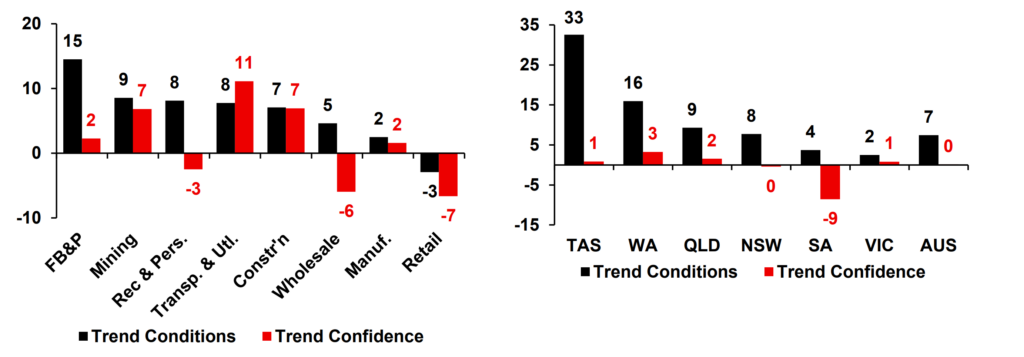
Retail remained negative in trend terms, but other industries, especially finance, business, and property, stayed positive.
Business Trend Conditions and Confidence by Industry and State Territory
Trends on Labor and Employment Per Industry
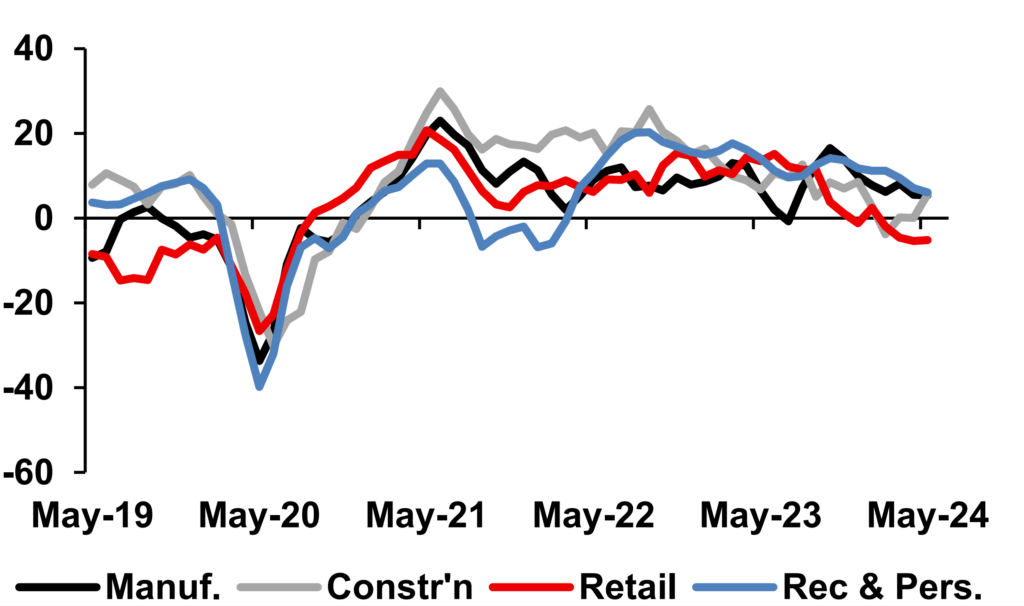
The chart shows employment trends across four different industries from May 19 to 24. The y-axis represents the net balance of employment changes, while the x-axis represents the time period.
The graph provides the employment trends of selected industries over a five-day period. On May 19, all industries had different employment levels. Around May 20, all employment levels sharply declined. After this drop, employment levels started to recover. The trend lines show that employment is stabilising, but fluctuations continue.
Conditions and Confidence Levels Per State
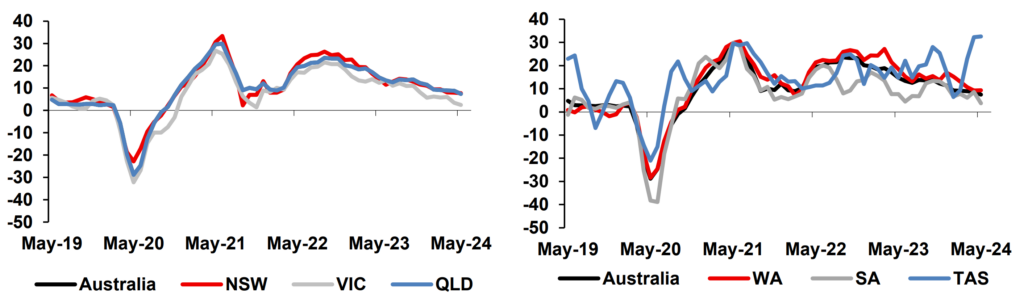
The charts show the varying conditions by comparing six states and Australia as a whole.
All states experienced a significant dip around May 20, followed by a strong recovery around May 21. New South Wales (NSW), Victoria (VIC), and Queensland (QLD) show similar patterns, with sharp declines and subsequent recoveries. Meanwhile, Western Australia (WA), South Australia (SA), and Tasmania (TAS) have much more varied patterns from each other.