
The Australian Bureau of Statistics report indicates a trend of rising wages alongside declining company profits. In the first quarter of 2024, company gross profits dropped by 2.5%, following a decline of 0.7% in December 2023. On the other hand, wages and salaries increased by 0.6% during the same period.
Declining Company Gross Profits vs. Rising Salaries
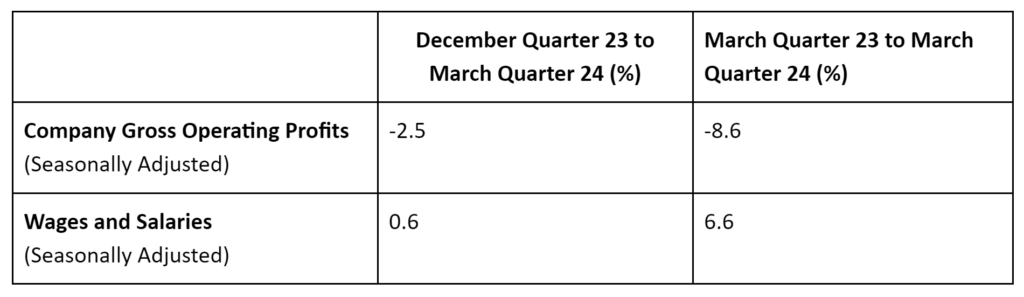
After accounting for seasonal changes between December 2023 and March 2024, companies’ gross operating profits decreased by 2.5%. At the same time, wages and salaries increased by 0.6%.
Looking at a longer period, from March 2023 to March 2024, the profit decline was more significant, at -8.6%. However, during this time, wages and salaries increased significantly, rising by 6.6%.
Overall Assessment of Company Gross Operating Profits versus Wages and Salaries Per Industry
| Services | Seasonally Adjusted Meaning Wages and Salaries | Seasonally Adjusted CGOP |
|---|---|---|
| Manufacturing | 1.90% ↑ ◉ | 2.10% ↑ ◉ |
| Construction | -1.50% ↓ ◉ | -1.20% ↓ ◉ |
| Retail | -0.80% ↓ ◉ | -0.50% ↓ ◉ |
| Accomodation and Food | 2.30% ↑ ◉ | 2.40% ↑ ◉ |
| Professional, Scientific, and Technical Services | 1.70% ↑ ◉ | 1.80% ↑ ◉ |
| Mining | 1.10% ↑ ◉ | -6.10% ↓ ◉ |
An overview of seasonally adjusted wages and salaries and company gross operating profits (CGOP) between December 2023 and March 2024
Manufacturing
| Year Month | Seasonally adjusted Wages ($m) | Seasonally adjusted CGOP ($m) |
|---|---|---|
| Mar 2021 | 14,140 | 9,483 |
| Jun 2021 | 14,285 | 9,457 |
| Sep 2021 | 14,170 | 10,128 |
| Dec 2021 | 14,392 | 12,699 |
| Mar 2022 | 14,564 | 11,214 |
| Jun 2022 | 15,138 | 12,758 |
| Sep 2022 | 15,271 | 10,015 |
| Dec 2022 | 15,337 | 11,407 |
| Mar 2023 | 15,511 | 12,002 |
| Jun 2023 | 15,627 | 11,237 |
| Sep 2023 | 16,008 | 11,524 |
| Dec 2023 | 16,160 | 11,616 |
| Mar 2024 | 16,464 | 11,864 |
Manufacturing in Chain Volume Measures
In the manufacturing sector, sales declined in March 2024, dropping to $100,789 million from $101,831 million in December 2023 (-1.0%). Inventories slightly increased to $58,373 million in March 2024 from $58,072 million in December 2023 (0.5%).
| Year Month | Seasonally adjusted Sales ($m) | Seasonally adjusted Inventories ($m) |
|---|---|---|
| Mar 2021 | 102,819 | 52,576 |
| Jun 2021 | 103,527 | 53,102 |
| Sep 2021 | 102,658 | 53,035 |
| Dec 2021 | 103,897 | 54,046 |
| Mar 2022 | 102,332 | 56,280 |
| Jun 2022 | 102,735 | 58,137 |
| Sep 2022 | 101,305 | 57,981 |
| Dec 2022 | 100,316 | 58,617 |
| Mar 2023 | 103,353 | 58,322 |
| Jun 2023 | 100,865 | 58,379 |
| Sep 2023 | 101,053 | 58,669 |
| Dec 2023 | 101,831 | 58,072 |
| Mar 2024 | 100,789 | 58,373 |
Construction
In the construction sector, seasonally adjusted wages decreased to $20,276 million in March 2024 from $20,404 million in December 2023 (-0.6%). Similarly, CGOP fell to $7,816 million in March 2024 from $7,913 million in December 2023 (-1.2%). This did not follow the usual trend of low gross operating profits and high salaries.
| Year Month | Seasonally adjusted Wages ($m) | Seasonally adjusted CGOP ($m) |
|---|---|---|
| Mar 2021 | 15,271 | 6,984 |
| Jun 2021 | 15,756 | 6,118 |
| Sep 2021 | 15,722 | 6,745 |
| Dec 2021 | 16,092 | 7,082 |
| Mar 2022 | 16,711 | 7,334 |
| Jun 2022 | 17,408 | 6,858 |
| Sep 2022 | 18,012 | 6,494 |
| Dec 2022 | 18,806 | 6,894 |
| Mar 2023 | 19,266 | 7,300 |
| Jun 2023 | 19,806 | 7,435 |
| Sep 2023 | 19,981 | 8,018 |
| Dec 2023 | 20,404 | 7,913 |
| Mar 2024 | 20,276 | 7,816 |
Construction in Chain Volume Measures
The construction sector saw a decline in sales during the March 2024 quarter, dropping to $95,040 million from $97,442 million in December 2023 (-2.5%). In contrast, the December 2023 quarter showed increased sales, rising to $97,442 million from $94,486 million in March 2023 (3.1%).
| Year Month | Seasonally adjusted Sales ($m) |
|---|---|
| Mar 2021 | 93,881 |
| Jun 2021 | 96,580 |
| Sep 2021 | 95,250 |
| Dec 2021 | 95,177 |
| Mar 2022 | 96,752 |
| Jun 2022 | 96,933 |
| Sep 2022 | 95,602 |
| Dec 2022 | 95,457 |
| Mar 2023 | 94,986 |
| Jun 2023 | 96,353 |
| Sep 2023 | 97,112 |
| Dec 2023 | 97,442 |
| Mar 2024 | 95,040 |
Retail Trade
In the retail trade sector, seasonally adjusted wages for the March 2024 quarter decreased slightly to $14,014 million, down from $14,059 million in December 2023 (-0.3%). Company gross operating profits (CGOP) also saw a minor decline, with $6,856 million reported in the March 2024 quarter compared to $6,919 million in the December 2023 quarter (-0.9%). This did not follow the usual trend of low gross operating profits and high salaries.
| Year Month | Seasonally adjusted Wages ($m) | Seasonally adjusted CGOP ($m) |
|---|---|---|
| Mar 2021 | 11,749 | 6,082 |
| Jun 2021 | 12,258 | 5,526 |
| Sep 2021 | 11,608 | 5,441 |
| Dec 2021 | 11,759 | 5,722 |
| Mar 2022 | 11,994 | 6,877 |
| Jun 2022 | 12,509 | 6,310 |
| Sep 2022 | 12,903 | 6,080 |
| Dec 2022 | 13,344 | 6,821 |
| Mar 2023 | 13,501 | 6,784 |
| Jun 2023 | 13,786 | 7,009 |
| Sep 2023 | 13,931 | 7,640 |
| Dec 2023 | 14,059 | 6,919 |
| Mar 2024 | 14,014 | 6,856 |
Retail Trade in Chain Volume Measures
In the March 2024 quarter, the retail trade sector saw sales of goods and services increase to $127,000 million from $126,660 million in the December 2023 quarter (0.3%). Inventories also grew from $42,673 million in December 2023 to $43,704 million in March 2024 (2.4%)
| Year Month | Seasonally adjusted Sales ($m) | Seasonally adjusted Inventories ($m) |
|---|---|---|
| Mar 2021 | 120,298 | 41,169 |
| Jun 2021 | 120,826 | 40,801 |
| Sep 2021 | 114,384 | 40,684 |
| Dec 2021 | 121,293 | 40,583 |
| Mar 2022 | 122,424 | 42,715 |
| Jun 2022 | 122,695 | 42,634 |
| Sep 2022 | 124,362 | 43,774 |
| Dec 2022 | 124,489 | 43,310 |
| Mar 2023 | 123,374 | 43,190 |
| Jun 2023 | 123,735 | 42,817 |
| Sep 2023 | 125,566 | 42,787 |
| Dec 2023 | 126,660 | 42,673 |
| Mar 2024 | 127,000 | 43,704 |
Accommodation and Food Services
In the accommodation and food services sector, wages increased from $7,744 million in December 2023 to $7,801 million in March 2024 (0.7%), while CGOP rose from $1,579 million to $1,595 million during the same period (1.0%).
| Year Month | Seasonally adjusted Wages ($m) | Seasonally adjusted CGOP ($m) |
|---|---|---|
| Mar 2021 | 5,918 | 1,806 |
| Jun 2021 | 6,172 | 1,563 |
| Sep 2021 | 4,667 | 1,324 |
| Dec 2021 | 5,429 | 1,201 |
| Mar 2022 | 5,633 | 681 |
| Jun 2022 | 6,466 | 1,029 |
| Sep 2022 | 6,793 | 1,559 |
| Dec 2022 | 7,266 | 1,824 |
| Mar 2023 | 7,416 | 1,571 |
| Jun 2023 | 7,349 | 1,484 |
| Sep 2023 | 7,685 | 1,611 |
| Dec 2023 | 7,744 | 1,579 |
| Mar 2024 | 7,801 | 1,595 |
Accommodation and Food Services in Chain Volume Measures
In the accommodation and food services sector, seasonally adjusted sales for March 2024 were $29,779 million, a decrease from $30,243 million in December 2023 (1.5%). Inventories also decreased, with the March 2024 quarter reporting $1,824 million compared to $1,917 million in the December 2023 quarter (-4.9%)
| Year Month | Seasonally adjusted Sales ($m) | Seasonally adjusted Inventories ($m) |
|---|---|---|
| Mar 2021 | 25,861 | 1,551 |
| Jun 2021 | 26,480 | 1,608 |
| Sep 2021 | 19,609 | 1,647 |
| Dec 2021 | 25,268 | 1,697 |
| Mar 2022 | 25,763 | 1,751 |
| Jun 2022 | 28,545 | 1,853 |
| Sep 2022 | 28,892 | 1,923 |
| Dec 2022 | 30,452 | 1,962 |
| Mar 2023 | 30,698 | 2,135 |
| Jun 2023 | 30,529 | 2,039 |
| Sep 2023 | 30,386 | 1,995 |
| Dec 2023 | 30,243 | 1,917 |
| Mar 2024 | 29,779 | 1,824 |
Professional, Scientific, and Technical Services
In the Professional, Scientific, and Technical Services sector, seasonally adjusted wages and salaries increased to $25,488 million in March 2024 from $25,155 million in December 2023 (1.3%). Similarly, company gross operating profits (CGOP) increased, reaching $7,369 million in March 2024 compared to $7,126 million in December 2023 (3.4%).
| Year Month | Seasonally adjusted Wages ($m) | Seasonally adjusted CGOP ($m) |
|---|---|---|
| Mar 2021 | 20,287 | 6,272 |
| Jun 2021 | 20,463 | 6,708 |
| Sep 2021 | 20,990 | 7,243 |
| Dec 2021 | 21,447 | 7,631 |
| Mar 2022 | 21,753 | 5,287 |
| Jun 2022 | 22,208 | 5,252 |
| Sep 2022 | 22,991 | 5,896 |
| Dec 2022 | 23,472 | 6,806 |
| Mar 2023 | 23,900 | 7,321 |
| Jun 2023 | 24,521 | 6,873 |
| Sep 2023 | 24,874 | 6,917 |
| Dec 2023 | 25,155 | 7,126 |
| Mar 2024 | 25,488 | 7,369 |
Professional, Scientific, and Technical Services in Chain Volume Measures
In the Professional, Scientific, and Technical Services sector, the seasonally adjusted sales for the March 2024 quarter were recorded at $63,732 million, an increase from the $63,708 million reported in December 2023. Sales of goods and services stayed about the same this quarter (0.04%).
| Year Month | Seasonally adjusted Sales ($m) |
|---|---|
| Mar 2021 | 58,509 |
| Jun 2021 | 58,671 |
| Sep 2021 | 58,124 |
| Dec 2021 | 60,702 |
| Mar 2022 | 62,453 |
| Jun 2022 | 62,978 |
| Sep 2022 | 63,820 |
| Dec 2022 | 62,864 |
| Mar 2023 | 62,379 |
| Jun 2023 | 62,488 |
| Sep 2023 | 62,945 |
| Dec 2023 | 63,708 |
| Mar 2024 | 63,732 |